For the complete documentation index, see llms.txt. Markdown versions of all docs pages are available by appending .md to any docs URL.
OTel stack
Deploy an open source observability stack based on OpenTelemetry (OTel) that includes the following components:
- Logs: Centralized log collection and storage with Grafana Loki.
- Traces: Distributed tracing with Grafana Tempo.
- Metrics: Time-series metrics collection with Prometheus.
- Collection: Unified telemetry collection with OpenTelemetry Collector.
- Visualization: Comprehensive dashboards with Grafana.
About
Observability tools are essential to gain insight into the health and performance of your gateway proxies. OpenTelemetry (OTel) is a flexible, open source framework that provides a set of APIs, libraries, and instrumentation to help capture and export observability data. However, you can follow a similar process as this guide to use the tools that you prefer.
Observability data types
Observability is built on three core pillars as described in the following table. By combining these three data types, you get a complete picture of your system’s health and performance.
| Pillar | Description |
|---|---|
| Logs | Discrete events that happen at a specific time with detailed context. |
| Metrics | Numerical measurements aggregated over time intervals. |
| Traces | Records of requests as they flow through distributed systems. |
Architecture
Review the following diagram to understand the architecture of the observability stack.
The gateway proxy acts as the primary telemetry generator. OTel Collectors route logs and traces to their storage backends, while Prometheus scrapes metrics directly from the gateway pods via PodMonitor and ServiceMonitor resources.
    flowchart TD
    A["1- Application Traffic"] --> B["2- Gateway proxy"]
    B -->|"Logs & Traces (OTLP)"| C["3- OTel Collectors"]
    B -->|"Metrics (PodMonitor/\nServiceMonitor)"| D3["4- Prometheus"]
    C --> D1["4- Loki"]
    C --> D2["4- Tempo"]
    D1 --> E["5- Grafana"]
    D2 --> E
    D3 --> E
Architecture data flow:
- Application Traffic: Applications send requests to the gateway proxy.
- Gateway Processing: The gateway proxy processes requests and emits telemetry on two paths: it pushes logs and traces to the OTel Collectors via OTLP, and exposes metrics on dedicated ports for Prometheus to scrape.
- Telemetry Collection: OTel Collectors receive logs and traces and route them to Loki and Tempo. Prometheus scrapes the control plane and proxy metrics endpoints directly via PodMonitor and ServiceMonitor resources.
- Data Storage:
- Logs go to Loki for log aggregation and storage.
- Traces go to Tempo for distributed tracing storage.
- Metrics go to Prometheus for time-series metrics storage.
- Visualization: Grafana queries all three storage backends as data sources to create unified dashboards.
More considerations
Metrics collection: Prometheus scrapes the gateway control plane and proxy metrics endpoints directly via PodMonitor and ServiceMonitor resources (pull model). Logs and traces use the push model: the gateway proxy pushes OTLP data to the OTel Collectors, which forward them to Loki and Tempo respectively.
Debug exporter: The example pipelines in both OTel collectors set up the debug exporter. This exporter is useful for testing and validation purposes. However, for production scenarios, remove this exporter to avoid performance impacts.
Before you begin
Install the agentgateway control plane.Step 1: Install Grafana Loki and Tempo
Grafana is a suite of open source tools that help you analyze, visualize, and monitor data in your cluster. For the OTel stack, you install the following Grafana components:
- Loki: A log aggregation system that indexes metadata about your logs as a set of labels, not the actual log contents. This way, Loki is more cost-efficient and performant than traditional log aggregation systems.
Tip
Loki works best when you use structured logging in your applications, such as JSON format.
- Tempo: A distributed tracing system that stores trace data in object storage (like Amazon S3) and integrates seamlessly with Grafana for visualization. Distributed tracing helps you see how requests move through a microservices environment, which helps you identify performance bottlenecks, debug issues, and otherwise monitor your system’s health to ensure SLA compliance.
Steps to install:
Deploy Grafana Loki to your cluster.
helm upgrade --install loki loki \
--repo https://grafana.github.io/helm-charts \
--version 6.24.0 \
--namespace telemetry \
--create-namespace \
--values - <<EOF
loki:
  commonConfig:
    replication_factor: 1
  schemaConfig:
    configs:
      - from: 2024-04-01
        store: tsdb
        object_store: s3
        schema: v13
        index:
          prefix: loki_index_
          period: 24h
  auth_enabled: false
singleBinary:
  replicas: 1
minio:
  enabled: true
gateway:
  enabled: false
test:
  enabled: false
monitoring:
  selfMonitoring:
    enabled: false
    grafanaAgent:
      installOperator: false
lokiCanary:
  enabled: false
limits_config:
  allow_structured_metadata: true
memberlist:
  service:
    publishNotReadyAddresses: true
deploymentMode: SingleBinary
backend:
  replicas: 0
read:
  replicas: 0
write:
  replicas: 0
ingester:
  replicas: 0
querier:
  replicas: 0
queryFrontend:
  replicas: 0
queryScheduler:
  replicas: 0
distributor:
  replicas: 0
compactor:
  replicas: 0
indexGateway:
  replicas: 0
bloomCompactor:
  replicas: 0
bloomGateway:
  replicas: 0
EOF
Deploy Grafana Tempo to your cluster.
helm upgrade --install tempo tempo \
--repo https://grafana.github.io/helm-charts \
--version 1.16.0 \
--namespace telemetry \
--create-namespace \
--values - <<EOF
persistence:
  enabled: false
tempo:
  receivers:
    otlp:
      protocols:
        grpc:
          endpoint: 0.0.0.0:4317
EOF
Verify that the Grafana pods are running.
kubectl get pods -n telemetry -l 'app.kubernetes.io/name in (loki,tempo)'Example output:
NAME                   READY   STATUS    RESTARTS   AGE
loki-0                 2/2     Running   0          3m45s
loki-chunks-cache-0    2/2     Running   0          3m45s
loki-results-cache-0   2/2     Running   0          3m45s
tempo-0                1/1     Running   0          2m10s
Step 2: Install OTel Collectors for logs and traces
The OTel Collectors act as the routing hub for logs and traces. The gateway proxy pushes logs and traces to the collectors via OTLP, and each collector forwards data to Loki for logs and Tempo for traces. Metrics are handled separately. Prometheus scrapes the control plane and agentgateway proxy metrics endpoints directly via PodMonitor and ServiceMonitor resources, which you set up in a later step.
Deploy separate collectors for logs and traces so you can scale and tune each one independently.
Warning
The example pipelines in both OTel collectors set up the debug exporter. This exporter is useful for testing and validation purposes. However, for production scenarios, remove this exporter to avoid performance impacts.
Tip
The OTel stack sets up Tempo as your tracing backend. If you want to use a different tracing backend, check out the Alternative backends section.
Deploy the logs collector to process and forward application and access logs.
helm upgrade --install opentelemetry-collector-logs opentelemetry-collector \
--repo https://open-telemetry.github.io/opentelemetry-helm-charts \
--version 0.127.2 \
--set mode=deployment \
--set image.repository="otel/opentelemetry-collector-contrib" \
--set command.name="otelcol-contrib" \
--namespace=telemetry \
--create-namespace \
-f -<<EOF
config:
  receivers:
    otlp:
      protocols:
        grpc:
          endpoint: 0.0.0.0:4317
        http:
          endpoint: 0.0.0.0:4318
  exporters:
    otlphttp/loki:
      endpoint: http://loki.telemetry.svc.cluster.local:3100/otlp
      tls:
        insecure: true
    debug:
      verbosity: detailed
  service:
    pipelines:
      logs:
        receivers: [otlp]
        processors: [batch]
        exporters: [debug, otlphttp/loki]
EOF
Deploy the traces collector to handle distributed tracing data.
helm upgrade --install opentelemetry-collector-traces opentelemetry-collector \
--repo https://open-telemetry.github.io/opentelemetry-helm-charts \
--version 0.127.2 \
--set mode=deployment \
--set image.repository="otel/opentelemetry-collector-contrib" \
--set command.name="otelcol-contrib" \
--namespace=telemetry \
--create-namespace \
-f -<<EOF
config:
  receivers:
    otlp:
      protocols:
        grpc:
          endpoint: 0.0.0.0:4317
        http:
          endpoint: 0.0.0.0:4318
  exporters:
    otlp/tempo:
      endpoint: http://tempo.telemetry.svc.cluster.local:4317
      tls:
        insecure: true
    debug:
      verbosity: detailed
  service:
    pipelines:
      traces:
        receivers: [otlp]
        processors: [batch]
        exporters: [debug, otlp/tempo]
EOF
Verify that the OpenTelemetry collector pods are running.
kubectl get pods -n telemetry -l app.kubernetes.io/name=opentelemetry-collectorExample output:
NAME                                               READY   STATUS    RESTARTS   AGE
opentelemetry-collector-logs-676777487b-wbtkj      1/1     Running   0          56s
opentelemetry-collector-traces-7696858cf9-tjllx    1/1     Running   0          51s
Create an AgentgatewayPolicy resource that points the agentgateway proxy at the OTel logs collector that you created.
kubectl apply -f- <<EOF
apiVersion: agentgateway.dev/v1alpha1
kind: AgentgatewayPolicy
metadata:
  name: access-logs
  namespace: agentgateway-system
spec:
  targetRefs:
  - group: gateway.networking.k8s.io
    kind: Gateway
    name: agentgateway-proxy
  frontend:
    accessLog:
      otlp:
        backendRef:
          name: opentelemetry-collector-logs
          namespace: telemetry
          port: 4317
        protocol: GRPC
EOF
Create an AgentgatewayPolicy resource that points the agentgateway proxy at the OTel tracing collector that you created.
kubectl apply -f- <<EOF
apiVersion: agentgateway.dev/v1alpha1
kind: AgentgatewayPolicy
metadata:
  name: tracing
  namespace: agentgateway-system
spec:
  targetRefs:
    - kind: Gateway
      name: agentgateway-proxy
      group: gateway.networking.k8s.io
  frontend:
    tracing:
      backendRef:
        name: opentelemetry-collector-traces
        namespace: telemetry
        port: 4317
      protocol: GRPC
      randomSampling: "true"
EOF
Step 3: Set up Prometheus
Prometheus is a monitoring system and time-series database that collects metrics from configured targets at given intervals. It’s the de facto standard for metrics collection in cloud-native environments. You can use the PromQL query language to set up flexible queries and alerts based on the metrics. This guide uses the kube-prometheus-stack Helm chart, which bundles Prometheus, Grafana, and the Prometheus Operator.
Deploy Prometheus in your cluster.
helm upgrade --install kube-prometheus-stack kube-prometheus-stack \
--repo https://prometheus-community.github.io/helm-charts \
--version 75.6.1 \
--namespace telemetry \
--create-namespace \
--values - <<EOF
alertmanager:
  enabled: false
prometheus:
  prometheusSpec:
    ruleSelectorNilUsesHelmValues: false
    serviceMonitorSelectorNilUsesHelmValues: false
    podMonitorSelectorNilUsesHelmValues: false
    enableFeatures:
      - native-histograms
grafana:
  enabled: true
  defaultDashboardsEnabled: true
  sidecar:
    dashboards:
      searchNamespace: ALL
  datasources:
   datasources.yaml:
     apiVersion: 1
     datasources:
      - name: Prometheus
        type: prometheus
        uid: prometheus
        access: proxy
        orgId: 1
        url: http://kube-prometheus-stack-prometheus.telemetry:9090
        basicAuth: false
        editable: true
        jsonData:
          httpMethod: GET
          exemplarTraceIdDestinations:
          - name: trace_id
            datasourceUid: tempo
      - name: Tempo
        type: tempo
        access: browser
        basicAuth: false
        orgId: 1
        uid: tempo
        url: http://tempo.telemetry.svc.cluster.local:3100
        isDefault: false
        editable: true
      - orgId: 1
        name: Loki
        type: loki
        typeName: Loki
        access: browser
        url: http://loki.telemetry.svc.cluster.local:3100
        basicAuth: false
        isDefault: false
        editable: true
EOF
Verify that the Prometheus stack’s components are up and running.
kubectl get pods -n telemetry -l app.kubernetes.io/instance=kube-prometheus-stackExample output:
NAME                                                        READY   STATUS    RESTARTS   AGE
kube-prometheus-stack-grafana-b546d7755-ks7sn               3/3     Running   0          72s
kube-prometheus-stack-kube-state-metrics-684f8c7558-xhn2p   1/1     Running   0          72s
kube-prometheus-stack-operator-6dc9c666c5-pwzkb             1/1     Running   0          72s
kube-prometheus-stack-prometheus-node-exporter-z7csm        1/1     Running   0          72s
Step 4: Enable metrics scraping
Prometheus does not automatically scrape metrics from the agentgateway control plane and proxy metrics endpoints after you installed it. To enable scraping, set monitoring.enabled=true in the agentgateway Helm chart. This setting creates the following resources:
- A ServiceMonitor that scrapes the control plane deployment in the
agentgateway-systemnamespace on port9092. - A PodMonitor that scrapes proxy pods in the
agentgateway-systemnamespace for theagentgatewayGatewayClass on port15020.
Note
The PodMonitor only selects proxy pods in the release namespace and for the agentgateway GatewayClass by default. If your Gateway resources provision proxy pods in other namespaces, or if you use additional GatewayClasses, you need additional configuration. See Scrape additional proxy pods for the available options.
Upgrade your agentgateway installation to enable the monitoring resources.
helm upgrade -i agentgateway \
  oci://cr.agentgateway.dev/charts/agentgateway \
  --namespace agentgateway-system \
  --version  \
  --reuse-values \
  --set monitoring.enabled=true
Tip
The
monitoring.serviceMonitor.intervalfield controls the scrape interval for both the ServiceMonitor and PodMonitor. If not set, both scrape every 15 seconds. To use a different interval, add--set monitoring.serviceMonitor.interval=30sto the command above.Verify that the ServiceMonitor and PodMonitor resources were created.
kubectl get servicemonitor,podmonitor -n agentgateway-systemExample output:
NAME                                                     AGE
servicemonitor.monitoring.coreos.com/agentgateway        5s

NAME                                                     AGE
podmonitor.monitoring.coreos.com/agentgateway-proxy      5s
Both resources are created. Prometheus begins scraping on the next collection cycle (15 seconds by default).
Step 4: Explore Grafana dashboards
You can use the pre-built Grafana dashboards to observe the control and data plane statuses.
Download the agentgateway Grafana dashboard. This dashboard is maintained in the agentgateway repository and monitors both the control and data planes.
curl -L "https://raw.githubusercontent.com/agentgateway/agentgateway/main/controller/install/helm/agentgateway/files/agentgateway-dashboard.json" -o agentgateway.jsonImport the Grafana dashboard.
kubectl -n telemetry create cm agentgateway-dashboard \
--from-file=agentgateway.json
kubectl label -n telemetry cm agentgateway-dashboard grafana_dashboard=1
Open and log in to Grafana by using the username
adminand passwordprom-operator.open "http://$(kubectl -n telemetry get svc kube-prometheus-stack-grafana -o jsonpath="{.status.loadBalancer.ingress[0]['hostname','ip']}"):3000"Go to Dashboards > Agentgateway to open the Agentgateway dashboard that you imported. Verify that you see metrics, such as the proxy overview of CPU and memory usage, request rate by gateway, LLM token consumption, or MCP tool calls.
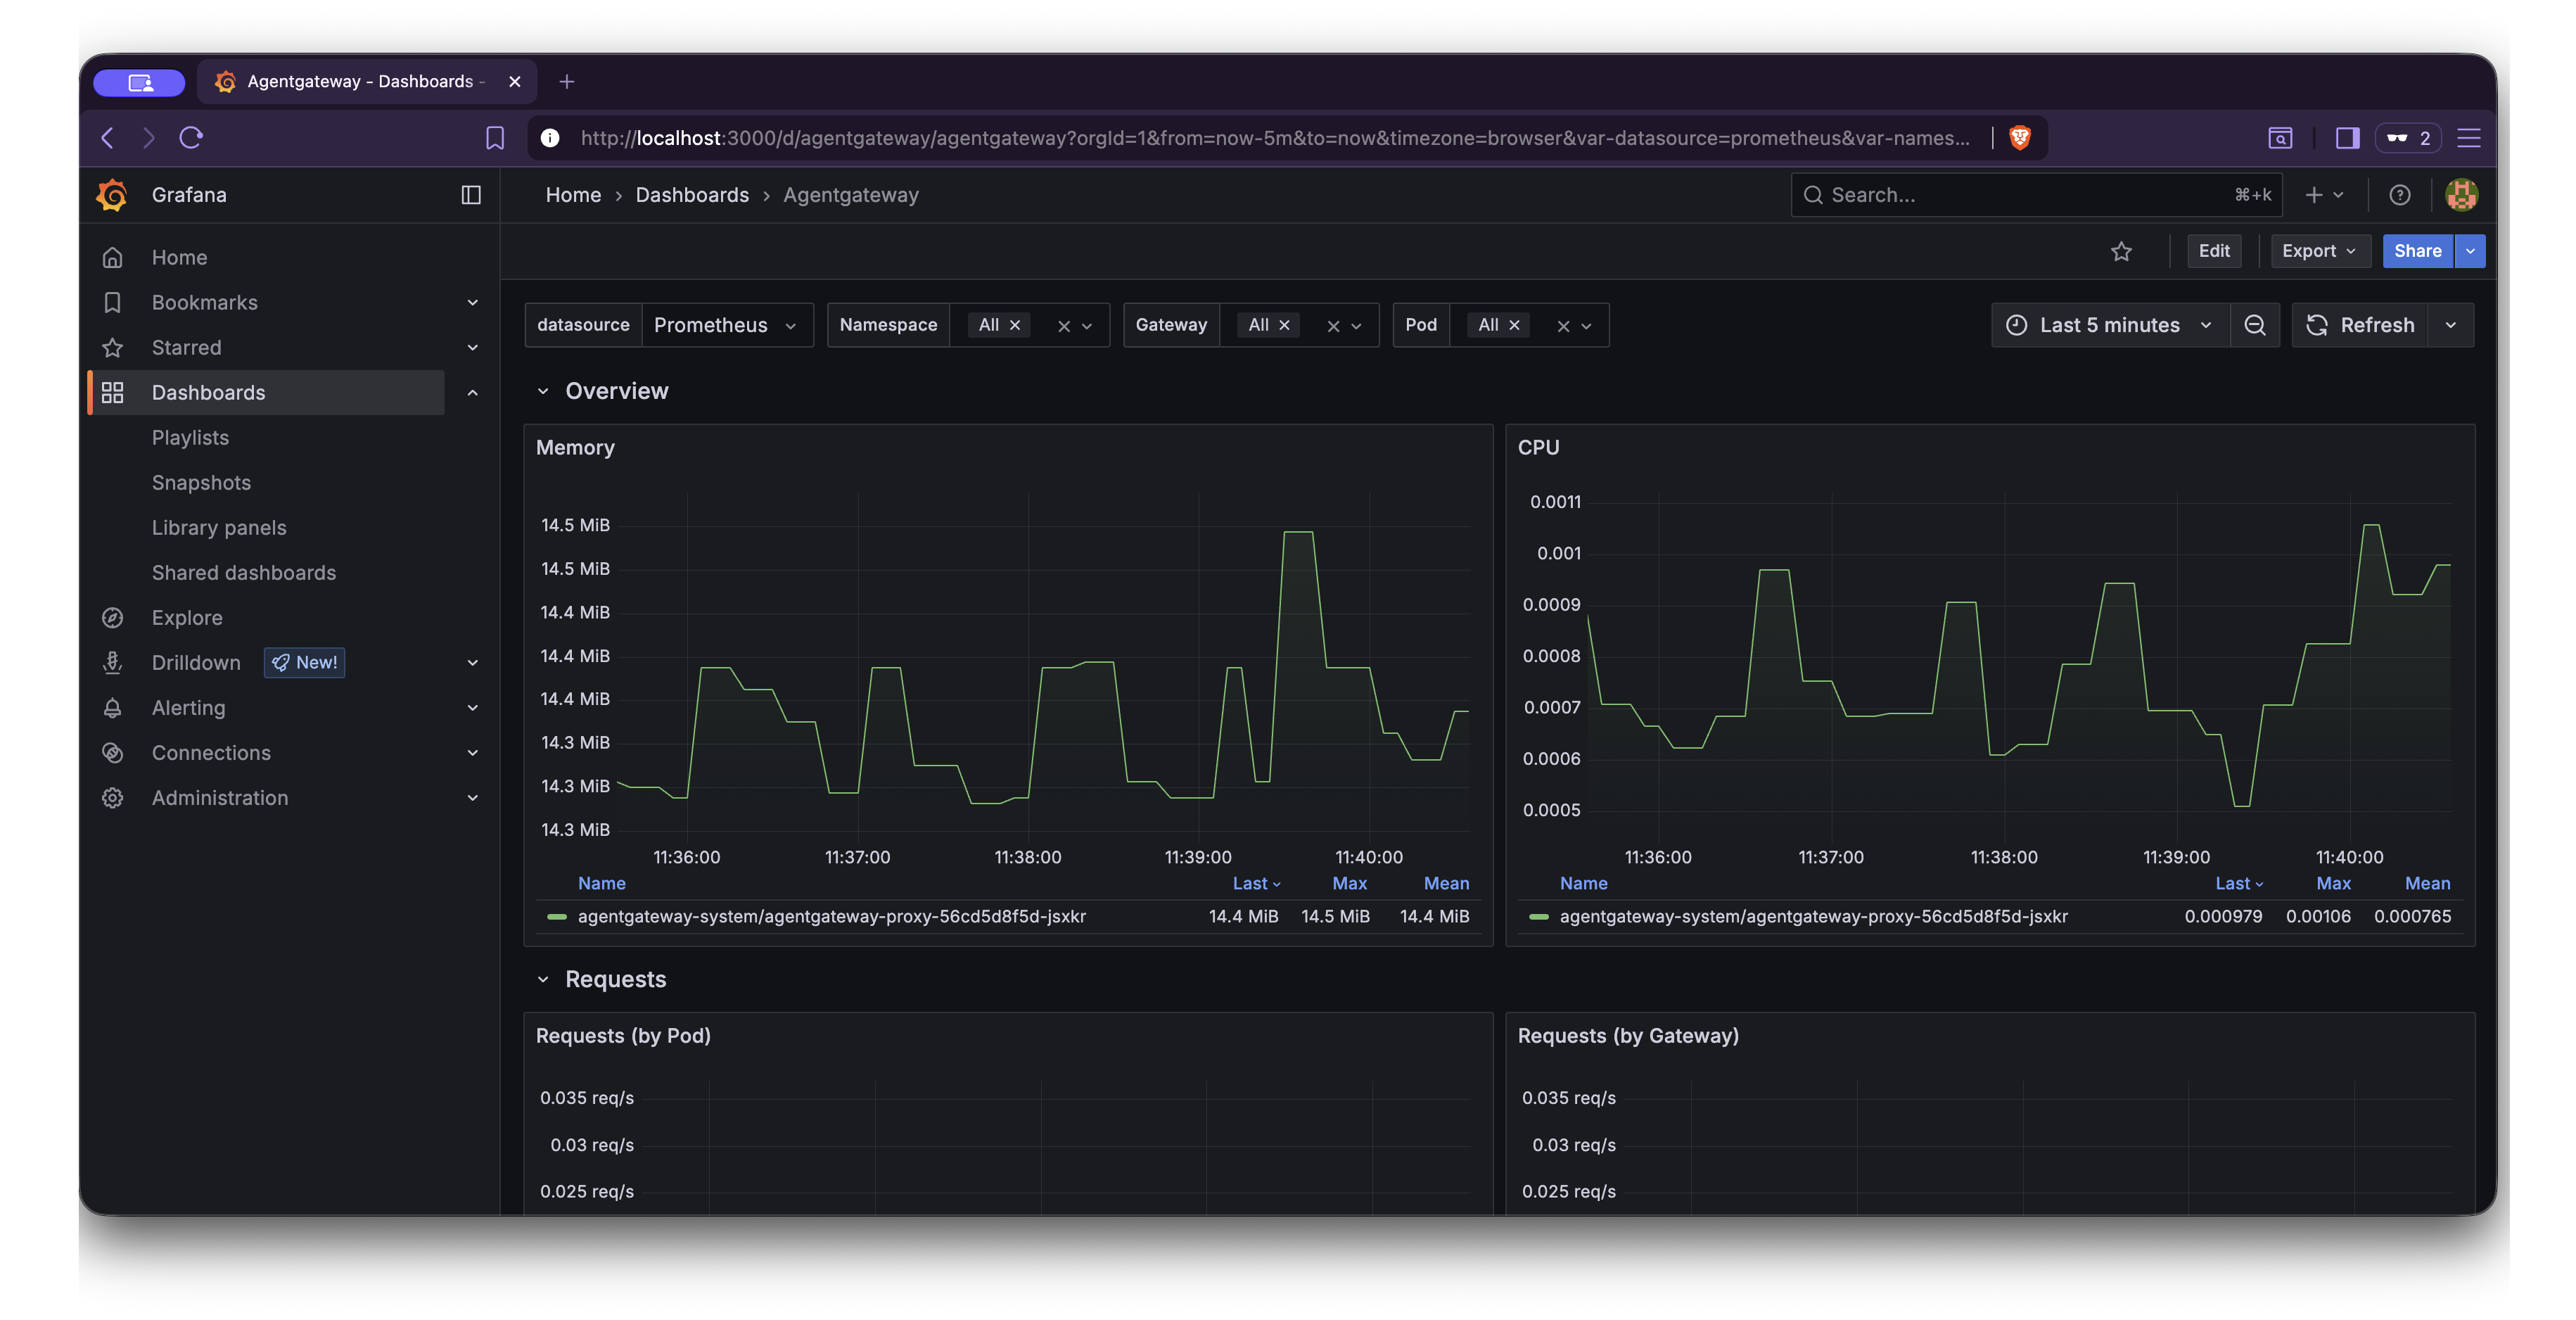
Section Metric Description Overview Memory The working set memory that each agentgateway proxy pod consumes. Overview CPU The CPU usage rate for each agentgateway proxy pod. Requests Requests (by Pod) The request rate that each agentgateway proxy pod handles. Requests Requests (by Gateway) The request rate for each gateway. Requests Requests (by Status) The request rate grouped by HTTP response status. Requests Requests (by Reason) The request rate grouped by the response reason. LLM Token Consumption The rate of tokens that LLM requests consume, grouped by token type, model, and gateway. LLM Time To First Token The time that it takes the LLM provider to return the first token of a response. LLM Request Time The total duration of LLM requests. LLM Tokens Per Second The rate at which the LLM provider returns output tokens. MCP MCP Calls (by method) The rate of MCP requests grouped by JSON-RPC method. MCP Tool Calls (by tool) The rate of MCP tool calls grouped by server, resource, and tool. Latency Latency by Route The 50th, 95th, and 99th percentile request latency for each gateway and route. XDS XDS Messages by Type The rate of xDS configuration messages that the control plane sends, grouped by resource type. XDS XDS Average Message Size The average size of xDS messages, grouped by resource type. Runtime Cgroup Memory The cgroup memory usage for each agentgateway proxy pod, such as working set, anonymous, file, and kernel memory. Runtime Process Memory The process-level memory for each agentgateway proxy pod, such as RSS, PSS, private, shared, and swap memory. Runtime Tokio Runtime The async runtime statistics for each agentgateway proxy pod, such as the worker count, number of alive tasks, and global queue depth. Runtime Build Versions The agentgateway build versions that are running, grouped by tag.
Cleanup
You can remove the resources that you created in this guide.Remove the configmap for the Envoy gateway proxy dashboard and delete the
envoy.jsonfile.kubectl delete cm agentgateway-dashboard -n telemetry rm agentgateway.jsonUninstall the Grafana Loki and Tempo components.
helm uninstall loki -n telemetry
helm uninstall tempo -n telemetry
Uninstall the OpenTelemetry collectors.
helm uninstall opentelemetry-collector-metrics -n telemetry
helm uninstall opentelemetry-collector-logs -n telemetry
helm uninstall opentelemetry-collector-traces -n telemetry
Uninstall the Prometheus stack.
helm uninstall kube-prometheus-stack -n telemetryRemove the
telemetrynamespace.kubectl delete namespace telemetry