For the complete documentation index, see llms.txt. Markdown versions of all docs pages are available by appending .md to any docs URL.
Export logs over OTLP
Export agentgateway access logs as OTLP LogRecord objects to an OpenTelemetry Collector or any compatible backend.
OpenTelemetry Protocol (OTLP) is a vendor-neutral standard for exporting telemetry data, including logs, metrics, and traces, to any OTLP-compatible backend. When you configure OTLP log export, agentgateway formats each access log as an OTLP LogRecord and sends it to an OpenTelemetry Collector, which can forward the data to backends, such as Loki, Elasticsearch, Grafana Cloud, or any other OTLP-compatible store.
Log export happens in addition to the standard stdout output, so you can send logs to an OTLP collector without losing local visibility. You can also filter which logs are exported independently of the stdout filter, and customize the exported fields independently of the stdout attributes.
Before you begin
- Set up an agentgateway proxy.
- Install the httpbin sample app.
Set up an OpenTelemetry collector
Set up the OTel stack. It includes an opentelemetry-collector-logs deployment in the telemetry namespace that accepts OTLP logs on port 4317 and forwards them to Loki for persistent storage.
If the OTel stack is already installed, skip to Configure OTLP log export.
Configure OTLP log export
Create an AgentgatewayPolicy resource that points the agentgateway proxy at the OTel collector that you created.
kubectl apply -f- <<EOF
apiVersion: agentgateway.dev/v1alpha1
kind: AgentgatewayPolicy
metadata:
  name: access-logs
  namespace: agentgateway-system
spec:
  targetRefs:
  - group: gateway.networking.k8s.io
    kind: Gateway
    name: agentgateway-proxy
  frontend:
    accessLog:
      otlp:
        backendRef:
          name: opentelemetry-collector-logs
          namespace: telemetry
          port: 4317
        protocol: GRPC
EOF
Verify log export
Send a request to the httpbin app.
curl -i http://$INGRESS_GW_ADDRESS:80/get -H "host: www.example.com"Check for the access log record.
Port-forward the Grafana service on port
3000.kubectl port-forward svc/kube-prometheus-stack-grafana -n telemetry 3000:80Open Grafana at http://localhost:3000.
Log in with the
adminusername andprom-operatorpassword.Go to Explore, select Loki as the data source, and browse recent log entries. Each proxied request is stored as a log entry with attributes such as
gateway,http.method,http.path, andhttp.status.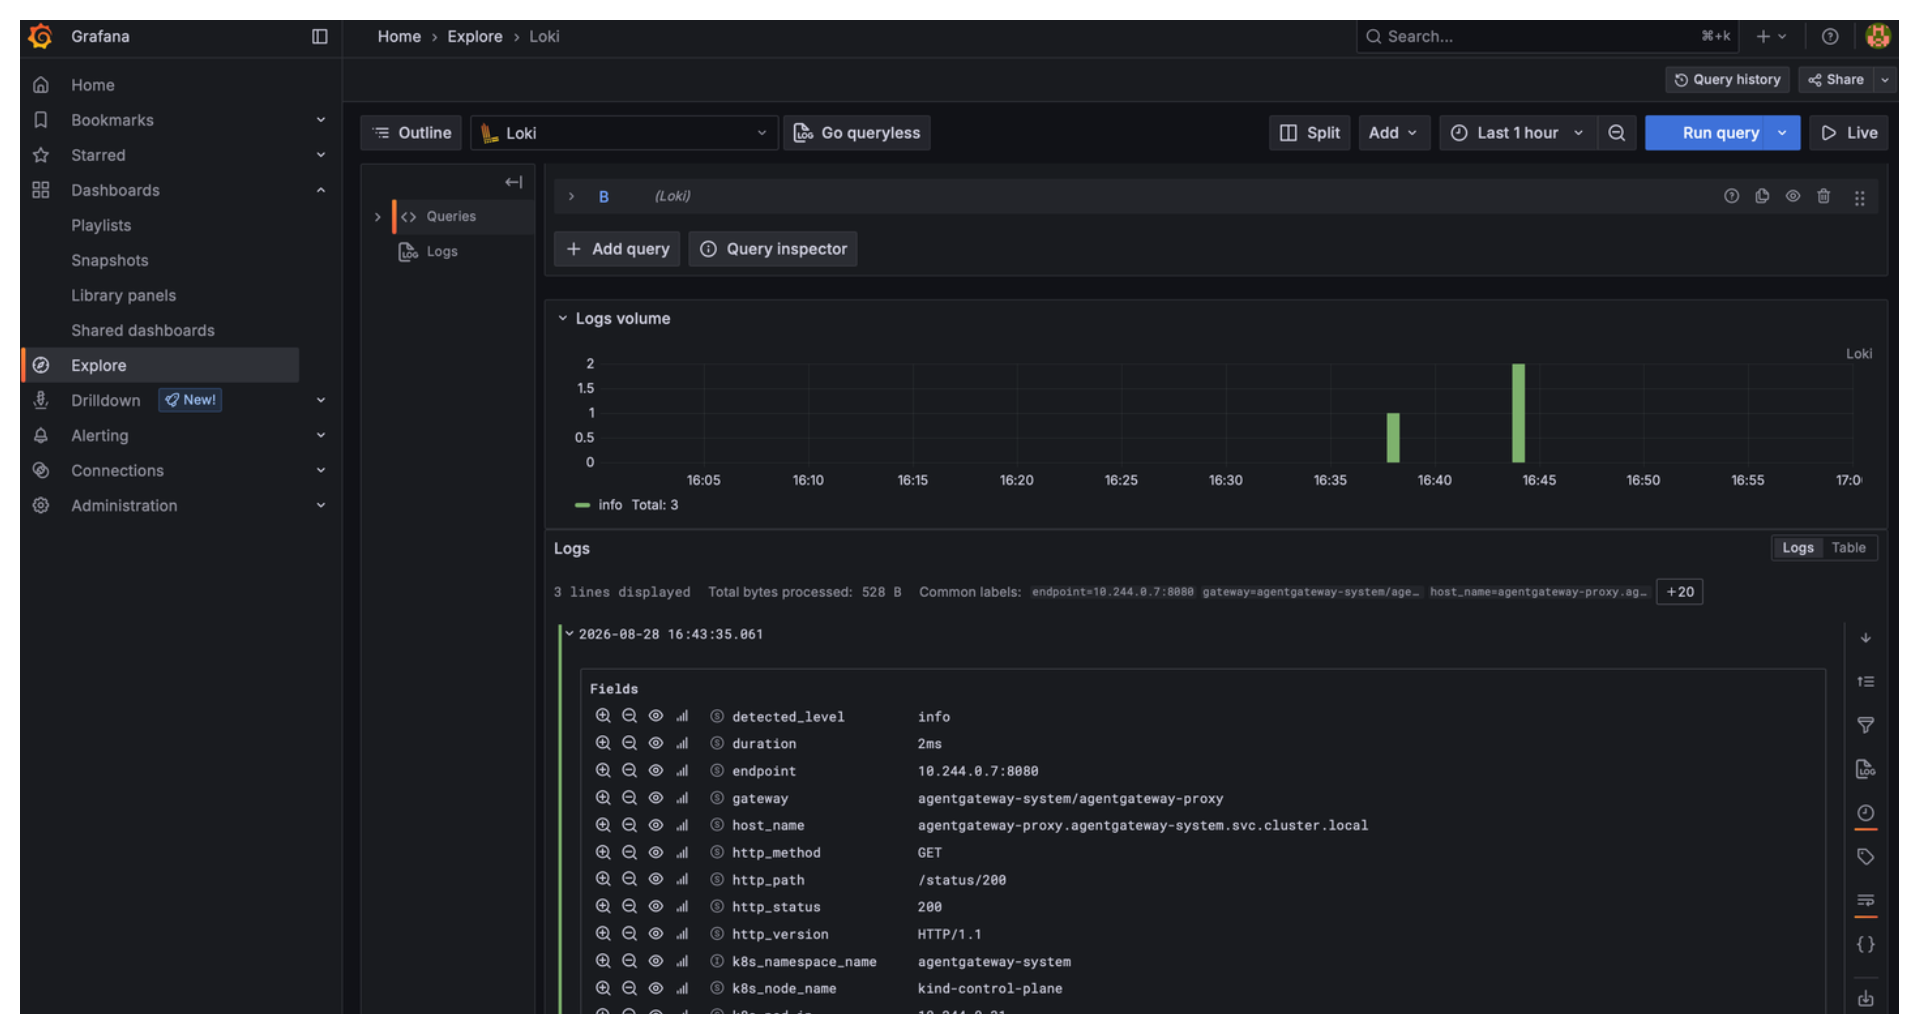
Filter logs before export
You can filter which access logs are exported to the OTLP backend independently of what is written to stdout by using the otlp.filter field. When otlp.filter is not set, the top-level accessLog.filter setting is used as a fallback for the OTLP export as well. When otlp.filter is set, it takes precedence over the top-level filter for OTLP export only, so stdout and OTLP can each receive a different subset of logs.
Update the AgentgatewayPolicy to add an
otlp.filterexpression. In this example, you want to send only error responses to the OTLP collector. However, you continue to log all requests to stdout.kubectl apply -f- <<EOF apiVersion: agentgateway.dev/v1alpha1 kind: AgentgatewayPolicy metadata: name: access-logs namespace: agentgateway-system spec: targetRefs: - group: gateway.networking.k8s.io kind: Gateway name: agentgateway-proxy frontend: accessLog: otlp: backendRef: name: opentelemetry-collector-logs namespace: telemetry port: 4317 protocol: GRPC filter: 'response.code >= 400' EOFSend a successful request through agentgateway.
curl -i http://$INGRESS_GW_ADDRESS:80/get -H "host: www.example.com"Check the collector logs for the last 10 seconds and verify that no
LogRecordappears. Because the response code was200, theotlp.filterexpressionresponse.code >= 400does not match and nothing is exported.kubectl logs deploy/opentelemetry-collector-logs -n telemetry --since=10s | grep "LogRecord"The command returns no output if the filter is working correctly.
Send a request that returns an error response.
curl -i http://$INGRESS_GW_ADDRESS:80/status/500 -H "host: www.example.com"Check the collector logs again and verify that a
LogRecordnow appears for the error response.kubectl logs deploy/opentelemetry-collector-logs -n telemetry | grep -A 5 "LogRecord"Example output:
LogRecord #0
...
  -> http.path: Str(/status/500)
  -> http.status: Int(500)
Check the proxy logs and verify that both requests appear in stdout. The
otlp.filterexpression only controls what is exported to the collector — stdout continues to receive all access log entries regardless of the filter.kubectl -n agentgateway-system logs deployments/agentgateway-proxy | tail -2Example output:
info	request ... http.path=/get http.version=HTTP/1.1 http.status=200 protocol=http duration=0ms
info	request ... http.path=/status/500 http.version=HTTP/1.1 http.status=500 protocol=http duration=0ms
Tip
To send all requests to the OTLP collector while restricting stdout to errors only, set otlp.filter: 'true' and add a top-level filter for stdout:
frontend:
  accessLog:
    filter: 'response.code >= 400'
    otlp:
      backendRef:
        name: opentelemetry-collector-logs
        namespace: telemetry
        port: 4317
      protocol: GRPC
      filter: 'true'
Customize exported fields
You can customize which fields are exported over OTLP independently of what is written to stdout by using the otlp.attributes field. If the otlp.attributes section is set, it replaces any custom attributes that you set for the stdout stream in the accessLog.attributes section. This setup allows you to add specific fields to your stdout output, and to log a different set of fields when you export the access logs via OTLP.
Note
If you do not set custom OTLP attributes, but you set custom fields via the top-level accessLog.attributes section, the accessLog.attributes are also applied to the OTLP export. If you do not want the top-level attributes to also apply in your OTLP export, overwrite them or remove them in the otlp.attributes section.
Update the AgentgatewayPolicy to add an
otlp.attributesconfiguration. In this example, you add atrace_idfield from thex-trace-idrequest header and remove thehttp.hostfield from OTLP exports. Because no top-levelaccessLog.attributesare defined, the access log output for stdout remains unchanged.kubectl apply -f- <<EOF apiVersion: agentgateway.dev/v1alpha1 kind: AgentgatewayPolicy metadata: name: access-logs namespace: agentgateway-system spec: targetRefs: - group: gateway.networking.k8s.io kind: Gateway name: agentgateway-proxy frontend: accessLog: otlp: backendRef: name: opentelemetry-collector-logs namespace: telemetry port: 4317 protocol: GRPC attributes: add: - name: trace_id expression: 'request.headers["x-trace-id"]' remove: - http.host EOFSend a request through agentgateway with the
x-trace-idheader.curl -i http://$INGRESS_GW_ADDRESS:80/get -H "host: www.example.com" -H "x-trace-id: abc123"Check the agentgateway proxy logs and verify that
http.hoststill appears in stdout and that you do not see thetrace_idfield, because theotlp.attributesfield only affects the OTLP export.kubectl logs deploy/agentgateway-proxy -n agentgateway-system | grep "http.host"Example output:
2026-08-27T19:46:25.383591Z	info	request gateway=agentgateway-system/agentgateway-proxy listener=http route=httpbin/httpbin endpoint=10.244.0.7:8080 src.addr=127.0.0.1:52632 http.method=GET http.host=www.example.com http.path=/get http.version=HTTP/1.1
http.status=200 protocol=http duration=2ms
Check the collector logs. Verify that the
trace_idfield appears with the value from the request header and that thehttp.hostfield is not present because it was removed by theotlp.attributes.removeconfiguration.kubectl logs deploy/opentelemetry-collector-logs -n telemetry | grep -A 20 "LogRecord"Example output:
LogRecord #0
...
Attributes:
  -> gateway: Str(agentgateway-system/agentgateway-proxy)
  -> listener: Str(http)
  -> route: Str(httpbin/httpbin)
  -> http.method: Str(GET)
  -> http.path: Str(/get)
  -> http.status: Int(200)
  -> trace_id: Str(abc123)
Cleanup
You can remove the resources that you created in this guide.Delete the AgentgatewayPolicy resource. The OTel stack collector stays in place.
kubectl delete AgentgatewayPolicy access-logs -n agentgateway-system