For the complete documentation index, see llms.txt. Markdown versions of all docs pages are available by appending .md to any docs URL.
Set up and customize traces
Configure distributed tracing for the agentgateway proxy using OpenTelemetry.
The agentgateway proxy does not emit traces by default. To enable tracing, create an AgentgatewayPolicy that points at an OTLP-compatible backend and sets a sampling rate for your traces.
When tracing is enabled, agentgateway emits HTTP, MCP, and LLM spans with attributes that follow the OpenTelemetry semantic conventions for generative AI.
Before you begin
- Set up an agentgateway proxy.
- Install the httpbin sample app.
Set up the OTel stack. The OTel stack installs the full tracing pipeline that this guide uses.
- OpenTelemetry Collector (
opentelemetry-collector-tracesin thetelemetrynamespace): Receives OTLP traces from the agentgateway proxy and forwards them to Tempo. - Tempo: Stores the traces.
- Grafana: Queries Tempo and lets you browse and search traces.
Tip
If you prefer to send traces to a different backend, see Alternative backends.
- OpenTelemetry Collector (
Enable tracing
If you have not done so yet, create an AgentgatewayPolicy that points the agentgateway proxy at your OTel Collector.
kubectl apply -f- <<EOF
apiVersion: agentgateway.dev/v1alpha1
kind: AgentgatewayPolicy
metadata:
  name: tracing
  namespace: agentgateway-system
spec:
  targetRefs:
    - kind: Gateway
      name: agentgateway-proxy
      group: gateway.networking.k8s.io
  frontend:
    tracing:
      backendRef:
        name: opentelemetry-collector-traces
        namespace: telemetry
        port: 4317
      protocol: GRPC
      randomSampling: "true"
EOF
Verify traces
Send a request to the httpbin app.
curl -vi -X POST http://$INGRESS_GW_ADDRESS:80/post \ -H "host: www.example.com"Open Grafana.
Port-forward the Grafana service.
kubectl port-forward svc/kube-prometheus-stack-grafana -n telemetry 3000:80Open Grafana at http://localhost:3000.
Log in to Grafana with the
adminusernameprom-operatorpassword.
Navigate to Explore, select Tempo as the data source, and search for traces. For example, you can use TraceQL queries to explore traces without a specific trace ID.
Goal TraceQL query All traces from the proxy {resource.service.name="agentgateway-proxy"}Traces for a specific HTTP path {resource.service.name="agentgateway-proxy" && span.http.path="/get"}Error traces (4xx/5xx) {resource.service.name="agentgateway-proxy" && span.http.status >= 400}Slow traces {resource.service.name="agentgateway-proxy"} | duration > 100ms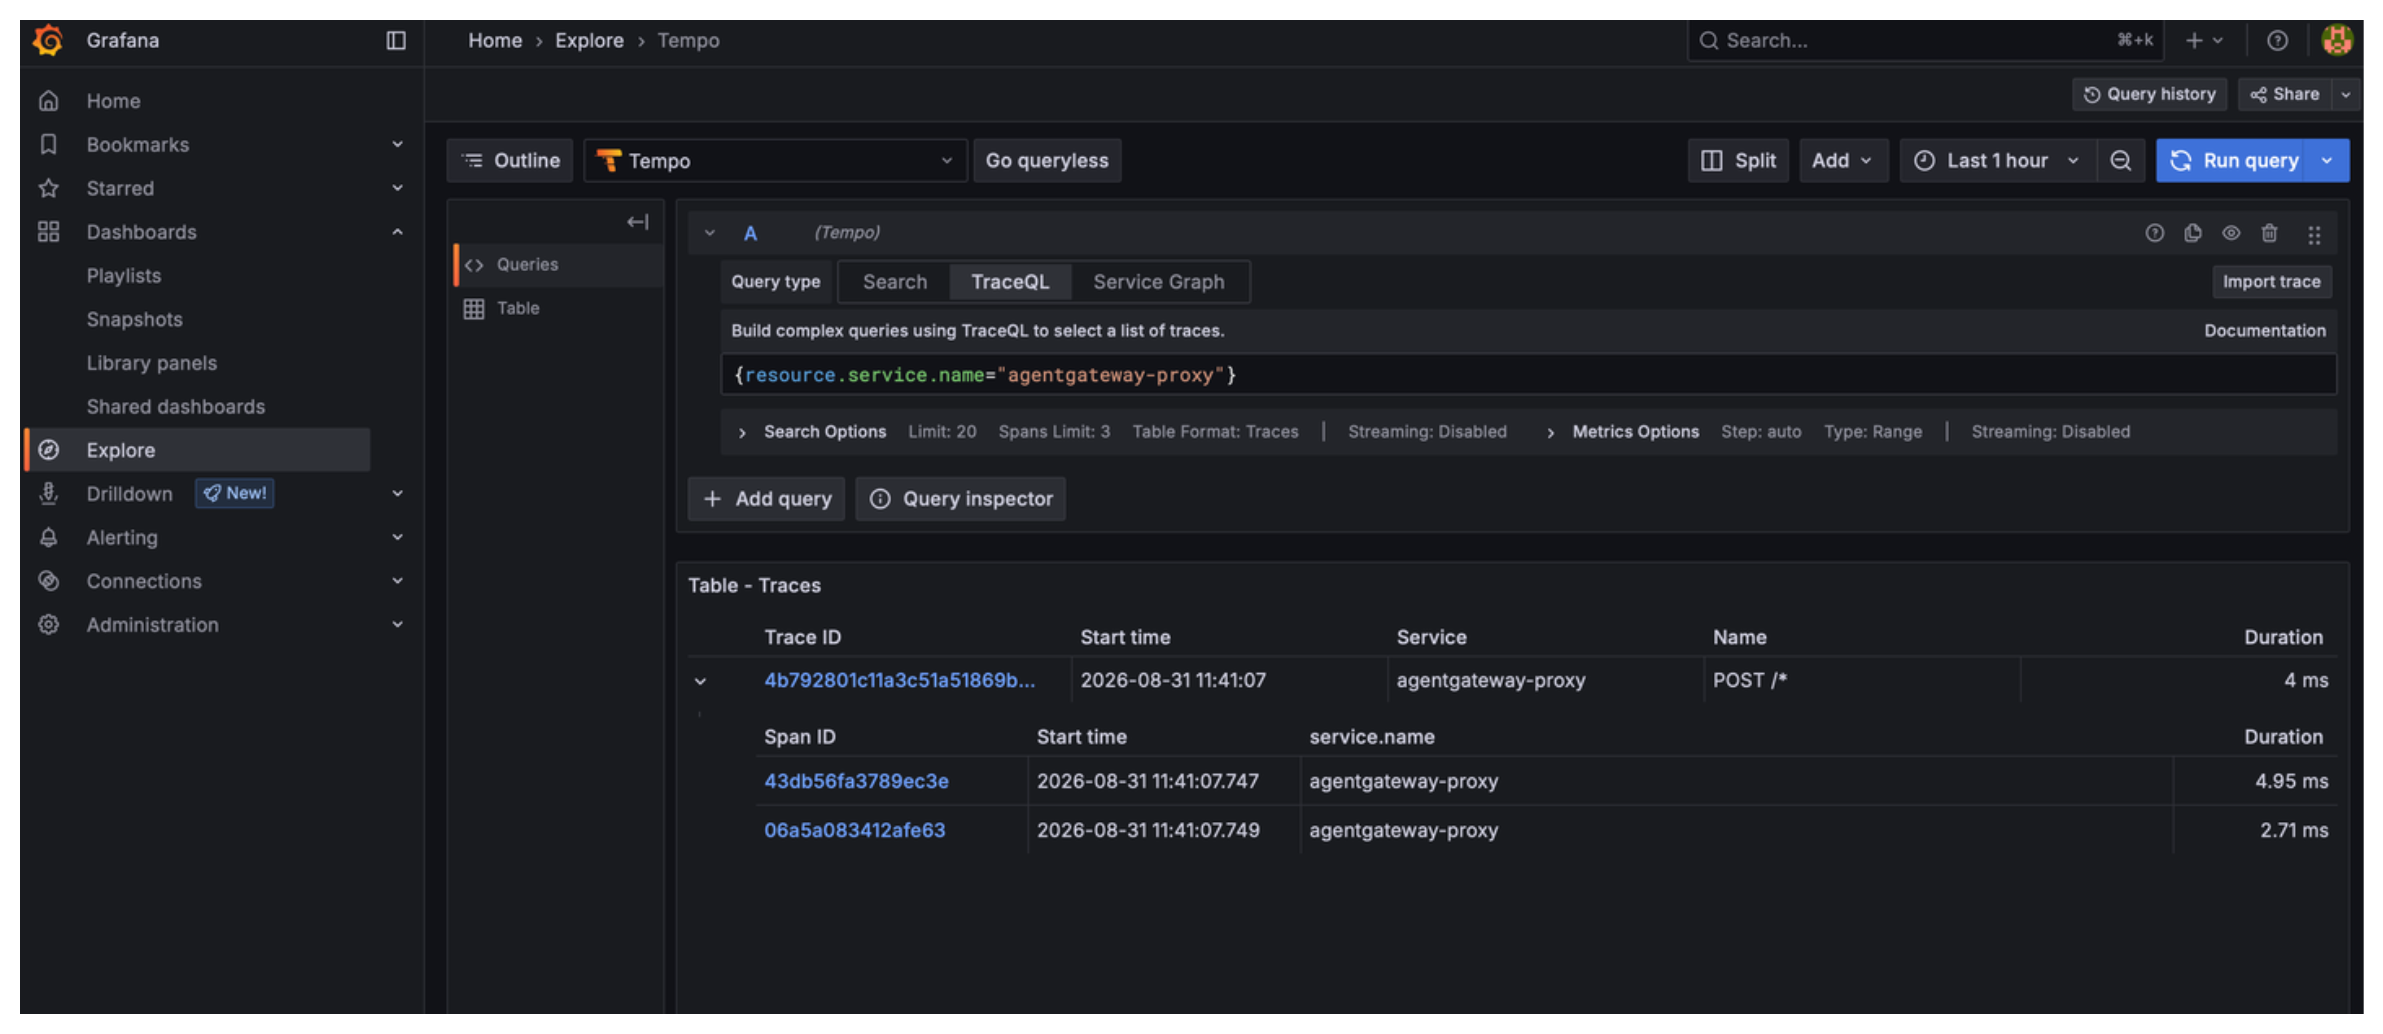
To search by a specific trace ID, get it from the proxy logs first:
kubectl logs deploy/agentgateway-proxy -n agentgateway-system \
| grep -o 'trace\.id=[^ ]*' | tail -1
Then paste the trace ID into the TraceQL or Search field in Grafana Tempo.
Control sampling rate
Sampling controls how much trace data agentgateway generates. Tracing every request gives complete visibility but adds overhead and increases storage costs. Sampling only a fraction keeps costs low while still capturing enough data to detect issues and understand latency.
Agentgateway has two independent sampling settings. Which one applies depends on whether the incoming request already carries trace context from an upstream client.
| Setting | Applies when | Default |
|---|---|---|
randomSampling | The incoming request carries no trace context, so the proxy decides whether to start a new trace. | false |
clientSampling | The incoming request already carries a trace from an upstream client. | true |
Both settings accept the same value format. For example, set the field to "true" to sample every applicable request, "false" to sample none, or a decimal string such as "0.1" to sample that fraction (10% in this case).
Because clientSampling defaults to "true", agentgateway already follows 100% of traces that a client started, even when randomSampling is "false". This means tracing is off by default for traffic that originates at the gateway, but on for traffic that flows through it as part of a distributed trace from an upstream service.
The following example shows a common production configuration where you follow all traces that clients already started, and sample a fraction of requests that originate at the gateway.
kubectl apply -f- <<EOF
apiVersion: agentgateway.dev/v1alpha1
kind: AgentgatewayPolicy
metadata:
  name: tracing
  namespace: agentgateway-system
spec:
  targetRefs:
    - kind: Gateway
      name: agentgateway-proxy
      group: gateway.networking.k8s.io
  frontend:
    tracing:
      backendRef:
        name: opentelemetry-collector-traces
        namespace: telemetry
        port: 4317
      protocol: GRPC
      randomSampling: "0.1"
      clientSampling: "true"
EOF
This configuration gives you a representative sample of gateway-originated traffic without overwhelming your tracing backend, while still capturing complete end-to-end traces from any upstream service that already started one.
Filter spans
Use the filter field to write a CEL expression that controls which sampled spans are exported to the OTel collector. A span is exported only when the expression evaluates to true. The filter runs after sampling, so it applies to all spans that are already selected by either randomSampling or clientSampling.
The following example exports only spans where the HTTP response code is 400 or greater.
kubectl apply -f- <<EOF
apiVersion: agentgateway.dev/v1alpha1
kind: AgentgatewayPolicy
metadata:
  name: tracing
  namespace: agentgateway-system
spec:
  targetRefs:
    - kind: Gateway
      name: agentgateway-proxy
      group: gateway.networking.k8s.io
  frontend:
    tracing:
      backendRef:
        name: opentelemetry-collector-traces
        namespace: telemetry
        port: 4317
      protocol: GRPC
      randomSampling: "true"
      filter: 'response.code >= 400'
EOF
Common filter patterns:
| Goal | CEL expression |
|---|---|
| Export only errors | response.code >= 400 |
| Export only LLM requests | gen_ai.provider != "" |
| Export by user | request.headers["x-user-id"] == "user-123" |
| Export errors or slow requests | response.code >= 400 || duration > 5000 |
For the full list of available CEL variables, see the CEL variables reference.
Customize span attributes
Agentgateway emits standard OpenTelemetry attributes on every span. You can add custom attributes or remove default ones. Attribute customization applies to all sampled spans, regardless of whether they were selected by randomSampling or clientSampling. For the full list of default attributes, see Span attribute reference.
Note
Customizing span attributes does not apply to policy call child spans, such as spans for ext_authz or rate limiting calls. Those spans have a fixed attribute set.
Add span and resource attributes
Use the attributes.add field to add custom tags to individual spans. Attribute values are CEL expressions that are evaluated on every request, so they can be dynamic.
Use the resources field to describe the agentgateway process itself. Resource values are static values that are added to every span. Your tracing backend uses resource attributes to label and group spans in its service list. The most common resource attribute is service.name, which defaults to agentgateway.
The following example sets the deployment environment and service name as resource attributes, and adds the user ID and request path as span attributes.
kubectl apply -f- <<EOF
apiVersion: agentgateway.dev/v1alpha1
kind: AgentgatewayPolicy
metadata:
  name: tracing
  namespace: agentgateway-system
spec:
  targetRefs:
    - kind: Gateway
      name: agentgateway-proxy
      group: gateway.networking.k8s.io
  frontend:
    tracing:
      backendRef:
        name: opentelemetry-collector-traces
        namespace: telemetry
        port: 4317
      protocol: GRPC
      randomSampling: "true"
      resources:
        - name: deployment.environment.name
          expression: '"production"'
        - name: service.name
          expression: '"my-agentgateway"'
      attributes:
        add:
          - name: user.id
            expression: 'request.headers["x-user-id"]'
          - name: request.path
            expression: 'request.path'
EOF
Remove span attributes
Use the attributes.remove field to drop attributes from spans. This is useful for stripping default attributes that are redundant or that you do not want to export.
The following example removes the source address and HTTP version from a trace span.
kubectl apply -f- <<EOF
apiVersion: agentgateway.dev/v1alpha1
kind: AgentgatewayPolicy
metadata:
  name: tracing
  namespace: agentgateway-system
spec:
  targetRefs:
    - kind: Gateway
      name: agentgateway-proxy
      group: gateway.networking.k8s.io
  frontend:
    tracing:
      backendRef:
        name: opentelemetry-collector-traces
        namespace: telemetry
        port: 4317
      protocol: GRPC
      randomSampling: "true"
      attributes:
        remove:
          - src.addr
          - http.version
EOF
Alternative backends
The primary setup routes traces through the OTel Collector from the OTel stack, which exports them to Tempo. You can route traces to any OTLP-compatible backend by changing the backendRef to point to a different service, or by using the url field to specify an endpoint directly.
Cleanup
You can remove the resources that you created in this guide.Delete the AgentgatewayPolicy resource.
kubectl delete AgentgatewayPolicy tracing -n agentgateway-system