For the complete documentation index, see llms.txt. Markdown versions of all docs pages are available by appending .md to any docs URL.
Debug your setup
Find and fix configuration and runtime problems in a standalone agentgateway using its admin endpoints and agctl.
Verified Code examples on this page have been automatically tested and verified.Inspect and troubleshoot a standalone agentgateway instance through the admin endpoints and the agctl command-line tool.
About
Agentgateway exposes an admin interface on 127.0.0.1:15000 by default. The admin interface is a local debugging endpoint for one running process. It provides the following endpoints for inspection and debugging.
The admin interface is not how you operate agentgateway day to day, and most installations never touch it. You reach it when you are debugging a specific problem on the host that runs the proxy, and you use agctl rather than raw endpoints for most of that.
Caution
The admin interface binds to the loopback interface, so only a client on the same host can reach it. Keep it that way. Endpoints such as /quitquitquit and /config_dump shut down the proxy and dump its full configuration to any caller that can open a connection.
Do not confuse the admin interface with the agentgateway UI, which is the web interface that you use to manage the proxy. The admin interface serves a copy of the UI as a convenience for local use, but the two are different surfaces: the UI belongs on a gateway, where you can authenticate it, and the debugging endpoints in the following table are served only on the admin address. For more information, see The UI and the admin interface are not the same thing.
| Endpoint | Description |
|---|---|
/config_dump | Returns the runtime configuration that agentgateway has loaded, including binds, listeners, routes, backends, workloads, services, and policies. |
/debug/trace | Streams a JSON-over-SSE trace of the next request that the proxy handles. The agctl proxy trace command consumes this endpoint. |
/logging | Get and set the logging level at runtime. |
/memory | Dump allocator and process memory statistics. |
/debug/pprof/profile | Build a CPU profile by using the pprof profiler. Available on Linux builds only. Use ?seconds=N to set the duration (1–300s, default 10s) and ?frequency=N to set the sampling rate in Hz (1–1000, default 100). |
/debug/pprof/heap | Collect heap profiling data. Contains allocation samples on Linux builds only. |
/debug/tasks | Inspect the live tokio task tree. |
/quitquitquit | Trigger a graceful shutdown of agentgateway. |
You rarely need to move the admin address, and you should not expose it. If you must change it, see Change the admin address.
To inspect the proxy’s configuration and to capture per-request traces, use the agctl command-line tool. agctl wraps the admin endpoints and renders their output in formats that are easier to scan than raw JSON.
Inspect the loaded configuration
To dump the configuration that the running proxy has loaded, capture the JSON from the /config_dump endpoint and pass it to agctl proxy config all.
Save the proxy’s config dump to a file.
curl -s http://127.0.0.1:15000/config_dump > /tmp/agw-dump.jsonRender it with
agctl. Use-o yamlfor a more readable view.agctl proxy config all --file /tmp/agw-dump.json -o yaml
For complete steps, see Inspect agentgateway configuration.
Trace requests
To capture a per-request trace as agentgateway processes it, use agctl proxy trace. The trace shows you the route that was selected, the policies that were applied, the backend that was chosen, and the response status. Tracing is invaluable for understanding why a request matched (or did not match) a route, why a policy was or was not applied, or why a request returned an unexpected status.
In one terminal, start a watch.
agctl proxy trace --localIn another terminal, send a request.
curl http://127.0.0.1:3000/headersagctlopens a text-based terminal user interface (TUI) that walks you through the request and response lifecycle. Use--rawto print JSON Lines instead.
For complete steps, including how to inject a request from agctl itself, see Trace requests with agctl.
Enable debug logs
Agentgateway uses the same level syntax as RUST_LOG: error, warn, info, debug, and trace. You can change the level at runtime through the /logging endpoint, or set it in your config file at startup.
Set the log level without restarting agentgateway. If you configured agentgateway to use a different admin address, update the host and port accordingly.
curl -X POST "http://localhost:15000/logging?level=debug"Example output:
current log level is typespec_client_core::http::policies::logging=warn,hickory_server::server::server_future=off,rmcp=warn,debugThe agentgateway process now writes debug log lines, such as the following.
2026-02-12T16:11:25.493503Z debug proxy::httpproxy request before normalization: Request { method: OPTIONS, uri: /sse?sessionId=...You can also set fine-grained levels per module by using the same RUST_LOG filter syntax, such as info,proxy::httpproxy=trace.
Capture profiles
Agentgateway includes pprof endpoints to help you investigate CPU and memory issues. Use the agctl proxy profile commands to read those endpoints and write the profile to a file.
Important
Profiling data is available only when agentgateway runs on Linux. On macOS and Windows builds, the CPU profile endpoint is not registered, so agctl proxy profile cpu fails with a 404 Not Found error, and agctl proxy profile heap writes a profile that contains no allocation samples.
Optional: If you have not already, download Graphviz to visualize the profiles.
Capture a CPU profile. The default duration is 30 seconds. Send traffic through agentgateway while the profile runs. Otherwise, the profile contains no samples.
agctl proxy profile cpu --local --seconds 30 -o ./cpu.pprofExample output:
Wrote cpu profile to ./cpu.pprofCapture a heap profile.
agctl proxy profile heap --local -o ./heap.pprofExample output:
Wrote heap profile to ./heap.pprofIf you omit
-o,agctlwrites the profile toagentgateway-cpu-<timestamp>.pb.gzoragentgateway-heap-<timestamp>.pb.gzin the current directory.Inspect the profile with
go tool pprof.CPU profile
go tool pprof -http=: cpu.pprofHeap profile
go tool pprof -http=: heap.pprofGraphviz opens on your web browser to a UI on localhost. Example:
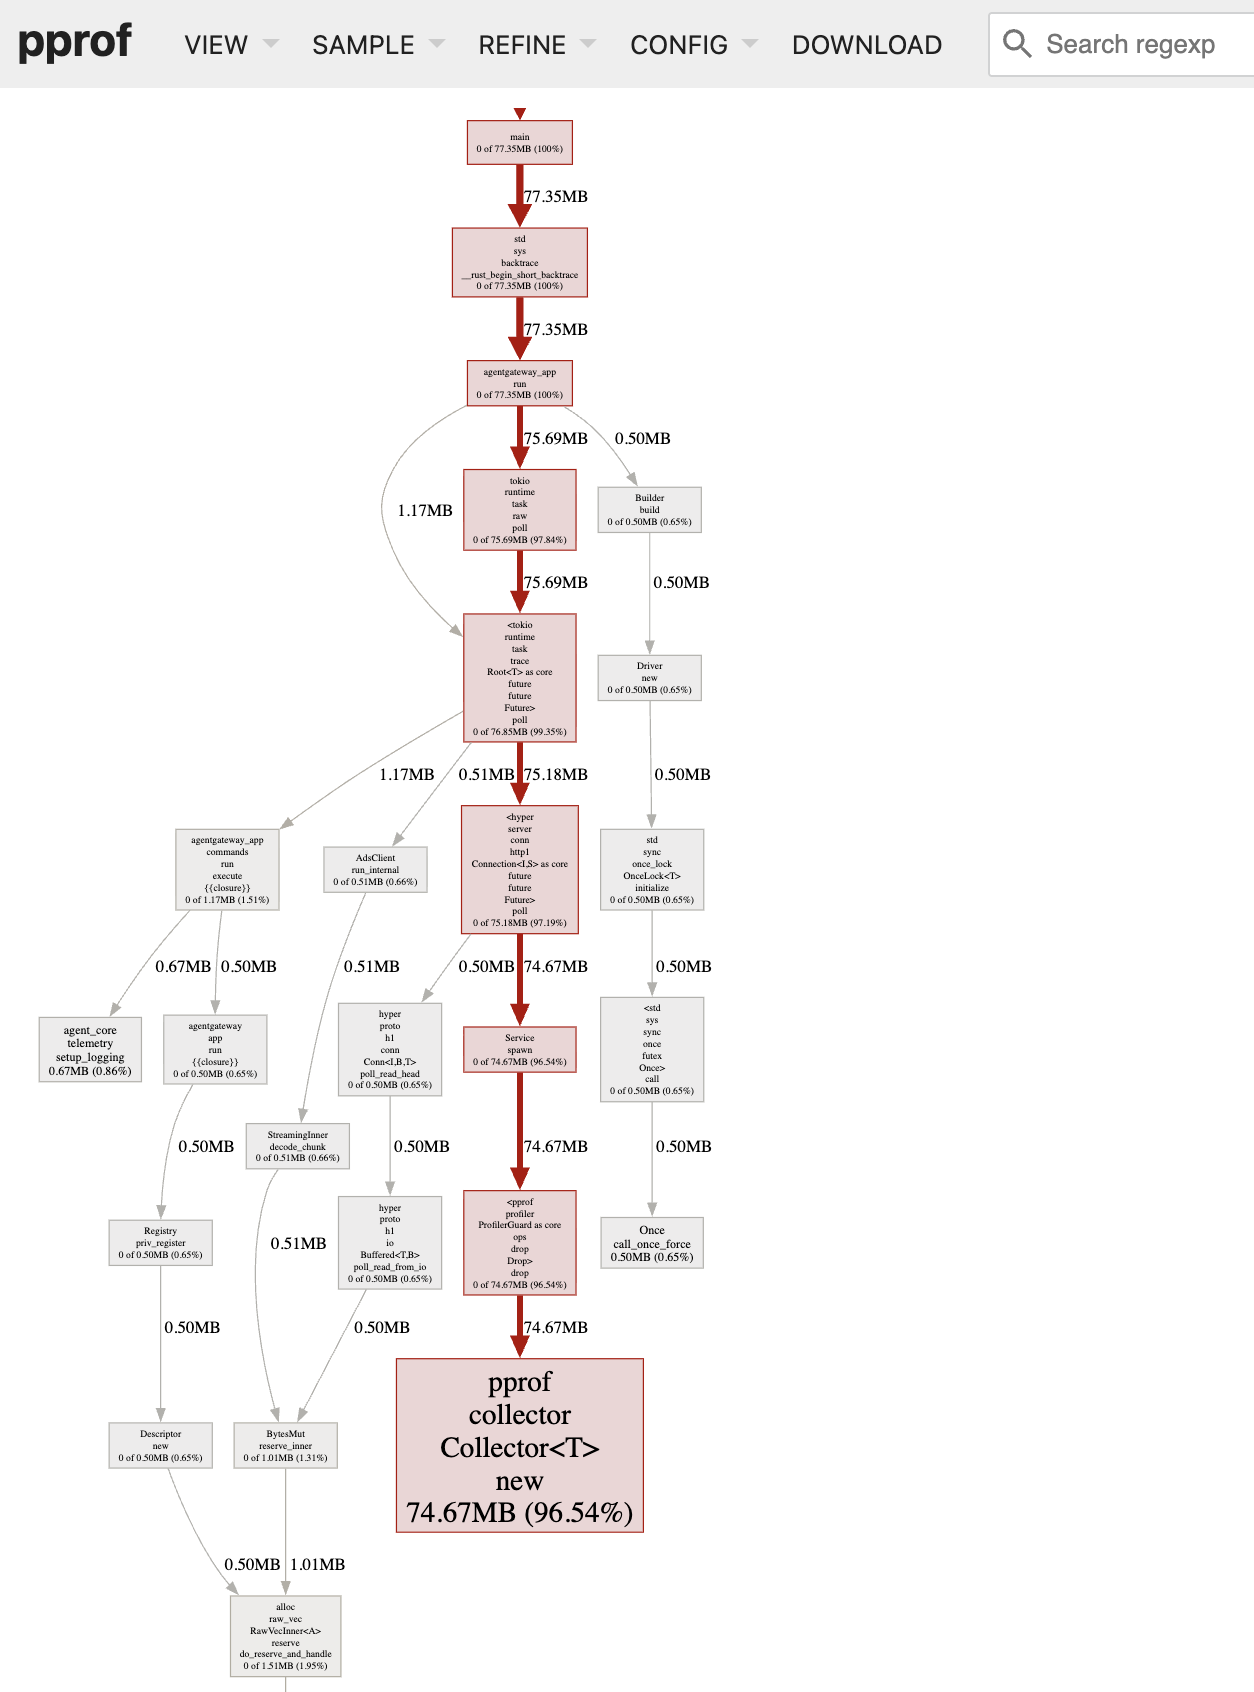
Heap profile graph Heap profile graph
Note
agctl proxy profile assumes that the admin server listens on port 15000. If you changed the admin address, pass the port with -p, such as agctl proxy profile heap --local -p 16000. You can also request the profiles directly from the admin endpoints, such as curl -o cpu.pprof "http://127.0.0.1:15000/debug/pprof/profile?seconds=30". Use the endpoints directly when you want to set the sampling rate with the frequency parameter, which agctl does not expose.
Change the admin address
Most installations leave the admin address alone. Change it only when the default port conflicts with something else on the host, or when you want to turn the admin interface off entirely.
The admin address is localhost:15000 in every installation method, whether or not the UI is also attached to a gateway. A gateway that serves the UI does not change the admin address, and changing the admin address does not change the gateway port. Set adminAddr in the config section of your configuration file to move the admin address, or to turn it off.
The value must use ip:port format, and also accepts unix:/path/to/socket or off. Setting off disables the admin interface altogether, which leaves a gateway in the ui section as the only way to reach the UI.
Tip
To reach the UI from another host, attach the UI to a gateway instead of moving the admin address. A gateway is the only location that you can put an authentication policy on. For more information, see Serve the UI on a gateway.
Add or update the
adminAddrfield in your configuration file.# yaml-language-server: $schema=https://agentgateway.dev/schema/config config: adminAddr: localhost:9090Start agentgateway with the updated config. Because
adminAddris in theconfigsection, a running instance keeps the previous address until you restart it.agentgateway -f config.yamlExample output:
INFO app serving UI at http://localhost:9090/ui
Confirm that the admin interface answers on the new address. In this example, the endpoints move to port
9090.curl -s -o /dev/null -w "%{http_code}\n" http://localhost:9090/config_dumpExample output:
200
Note
If you change adminAddr, update any command that calls the admin interface to use the new address. For example, change curl http://localhost:15000/logging to use the new port.
Reach the UI in a container
The default admin address binds to the container’s own loopback interface, so publishing port 15000 with -p 15000:15000 does not make it reachable from your host. You have two options.
Serve the UI on a gateway instead, which is what the generated configuration does. This is the better option, because you can attach authentication policies to the gateway, and because it leaves the admin interface where it belongs. For more information, see Serve the UI on a gateway.
Bind the admin address to all interfaces by setting
config.adminAddrto0.0.0.0:15000, then publish that port. Do this only on a host where nothing untrusted can reach the published port, such as your personal workstation.Caution
Binding the admin address to
0.0.0.0publishes unauthenticated shutdown and configuration-dump endpoints to every network that the host is attached to. Never do this on a shared or production host. Attach the UI to a gateway instead.# yaml-language-server: $schema=https://agentgateway.dev/schema/config config: adminAddr: 0.0.0.0:15000 gateways: default: port: 4000docker run -d \ --name agentgateway \ --user "$(id -u):$(id -g)" \ -v "$PWD/config.yaml:/config.yaml" \ -p 4000:4000 -p 15000:15000 \ cr.agentgateway.dev/agentgateway:v1.5.0 \ -f /config.yaml